Debugging: Difference between revisions
| (27 intermediate revisions by the same user not shown) | |||
| Line 1: | Line 1: | ||
This tutorial explains how to debug a BioCASe web service and a BioCASe installation in general. If you follow the instructions and don’t manage to get your service running, please contact the | This tutorial explains how to debug a BioCASe web service and a BioCASe installation in general. If you follow the instructions and don’t manage to get your service running, please [[Special:Contact|contact the BioCASe team]]. | ||
== Debugging a BioCASe Web Service == | == Debugging a BioCASe Web Service == | ||
| Line 9: | Line 9: | ||
On the entry page of a datasource, <small>TEST and DEBUG</small> will open the Query Form: | On the entry page of a datasource, <small>TEST and DEBUG</small> will open the Query Form: | ||
[[File:debugDatasourceEntryPage.png]] | [[File:debugDatasourceEntryPage.png|border]] | ||
In the data source configuration tool, the link to the according query form can be always found in the link list at the top of the page. Moreover, in the mapping editor, the button <small>Test mapping!</small> will open the Query Form in a separate tab: | In the data source configuration tool, the link to the according query form can be always found in the link list at the top of the page. Moreover, in the mapping editor, the button <small>Test mapping!</small> will open the Query Form in a separate tab: | ||
[[File:abcdMappingEditorEmptyTop.png]] | [[File:abcdMappingEditorEmptyTop.png|border]] | ||
=== Basic Usage === | === Basic Usage === | ||
On top of the Query Form you can see the URL of your web service. In this case it is http://localhost/biocase/pywrapper.cgi?dsa=flora, ''flora'' being the name of the datasource. Make sure this is the correct access point of the web service you want to debug! | On top of the Query Form you can see the URL of your web service. In this case it is ''<nowiki>http://localhost/biocase/pywrapper.cgi?dsa=flora</nowiki>'', ''flora'' being the name of the datasource. Make sure this is the correct access point of the web service you want to debug! | ||
[[File:debugQueryformFull.png]] | [[File:debugQueryformFull.png|border]] | ||
The usage of the Query Form is very | The usage of the Query Form is very straightforward: | ||
* Click on one of the links below the text box to load a template, for example for an ABCD2 Scan or ABCD2 Search; | * Click on one of the links below the text box to load a template, for example for an ABCD2 Scan or ABCD2 Search; | ||
| Line 32: | Line 32: | ||
=== Changing the Debug Level for a Data Source === | === Changing the Debug Level for a Data Source === | ||
Debug info can be set to one of four levels for a BioCASe data source: | Debug info can be set to one of four levels for a BioCASe data source: | ||
For most cases, keeping the default Info level should be sufficient for testing and debugging a web service. For production use, you should set it to Error later. You can do this in the configuration of a datasource under Settings: | * <strong>Error</strong> is the highest level will only output errors that prevent the web server from answering a request. | ||
* <strong>Warning</strong> will output errors that keep BioCASe from answering a request and warnings that don’t prevent the fulfilling of the request, but should be analysed carefully. For example, they might tell you that records have been dropped because mandatory ABCD elements have not been mapped or were empty for certain records. | |||
* <strong>Info</strong> is the default and will add some more information about how the Provider Software processes the request. | |||
* <strong>Debug</strong> is the most detailed level and will produce very verbose debug output. It adds very comprehensive information about how the ABCD documents are constructed and is suitable only for experienced users. | |||
For most cases, keeping the default ''Info'' level should be sufficient for testing and debugging a web service. For production use, you should set it to ''Error'' later. You can do this in the configuration of a datasource under Settings: | |||
[[File:debugDatasourceSettings.png|border]] | |||
== Analyzing the Response Document == | == Analyzing the Response Document == | ||
Upon clicking <small>Submit</small>, the Query Form will send the request to the web service and wait for the response. It might take some time – up to minutes – until the response document shows up. Amongst others, this depends on | Upon clicking <small>Submit</small>, the Query Form will send the request to the web service and wait for the response. It might take some time – up to minutes – until the response document shows up. Amongst others, this depends on | ||
( | * the complexity of the query (especially the filters), | ||
* the size of the dataset returned, | |||
* the debug level set (“debug” results in very exhaustive debug output), | |||
* the performance of the servers running BioCASe and the database, | |||
* the network bandwidth. | |||
The response document consists of three sections (a full response document can be found [[SampleABCDDocument|here]]): | |||
[[File:debugResponseDocumentOverview.png|border]] | |||
=== Header === | === Header === | ||
This section contains information about the BioCASe installation – operating system, DBMS used, Python/BioCASe version etc. It is intended for a consumer application and won’t be very helpful for debugging: | This section contains information about the BioCASe installation – operating system, DBMS used, Python/BioCASe version etc. It is intended for a consumer application and won’t be very helpful for debugging: | ||
<syntaxhighlight> | |||
<biocase:header> | <biocase:header> | ||
<biocase:version software="os">nt</biocase:version> | <biocase:version software="os">nt</biocase:version> | ||
<biocase:version software="python">2.5.4 (r254:67916, Dec 23 2008, 15:10:54) [MSC v.1310 32 bit (Intel)]</biocase:version> | <biocase:version software="python">2.5.4 (r254:67916, Dec 23 2008, 15:10:54) | ||
[MSC v.1310 32 bit (Intel)]</biocase:version> | |||
<biocase:version software="pywrapper">2.6.0</biocase:version> | <biocase:version software="pywrapper">2.6.0</biocase:version> | ||
<biocase:version software="dbmod">MS SQL Server module v1.01 using ceODBC ?</biocase:version> | <biocase:version software="dbmod">MS SQL Server module v1.01 using ceODBC ?</biocase:version> | ||
| Line 63: | Line 69: | ||
<biocase:destination>127.0.0.1</biocase:destination> | <biocase:destination>127.0.0.1</biocase:destination> | ||
<biocase:type>search</biocase:type> | <biocase:type>search</biocase:type> | ||
</biocase:header> | |||
</syntaxhighlight> | |||
=== Content === | === Content === | ||
This section makes up the payload of the response document, depending on the type of request: | This section makes up the payload of the response document, depending on the type of request: | ||
<biocase:content recordCount=" | <strong>Capabilities:</strong> Lists all schemas supported by the web service. For each schema, all mapped concepts (identified by their XPaths) are listed with data type and searchable flag. | ||
<syntaxhighlight> | |||
<biocase:content recordCount="0" recordDropped="0" recordStart="0" totalSearchHits="0"> | |||
<biocase:capabilities> | |||
<biocase:SupportedSchemas namespace="http://www.tdwg.org/schemas/abcd/2.06" request="true" response="true"> | |||
<biocase:Concept datatype="normalizedString" searchable="1">/DataSets/DataSet/ContentContacts/ContentContact/Address</biocase:Concept> | |||
<biocase:Concept datatype="normalizedString" searchable="1">/DataSets/DataSet/ContentContacts/ContentContact/Email</biocase:Concept> | |||
<biocase:Concept datatype="normalizedString" searchable="1">/DataSets/DataSet/ContentContacts/ContentContact/Name</biocase:Concept> | |||
<biocase:Concept datatype="normalizedString" searchable="1">/DataSets/DataSet/Metadata/Description/Representation/Details</biocase:Concept> | |||
... | |||
</biocase:SupportedSchemas> | |||
</biocase:capabilities> | |||
</biocase:content> | |||
</syntaxhighlight> | |||
<strong>Scan:</strong> The document will simply list all distinct values for the concept specified in the request. When done for the scientific name, it would look similar to this: | |||
=== Debug Output === | <syntaxhighlight> | ||
This section is the most interesting part for debugging. If debug level is set to Info (which is recommended for debugging), it will document the processing of the request by the web service. The output is easy to understand, for example it will contain the SQL statements sent to the database. | <biocase:content recordCount="1664" recordDropped="0" recordStart="0" totalSearchHits="1664"> | ||
<biocase:scan> | |||
<biocase:value>Achillea atrata L.</biocase:value> | |||
<biocase:value>Achillea millefolium L.</biocase:value> | |||
<biocase:value>Achillea nobilis L. ssp. nobilis</biocase:value> | |||
<biocase:value>Achillea ptarmica L.</biocase:value> | |||
<biocase:value>Acinos alpinus (L.) Moench</biocase:value> | |||
<biocase:value>Acinos arvensis (Lam.) Dandy</biocase:value> | |||
<biocase:value>Aconitum degenii ssp. paniculatum (Arcang.) Mucher</biocase:value> | |||
<biocase:value>Aconitum lycoctonum L. ssp. lycoctonum</biocase:value> | |||
<biocase:value>Aconitum napellus L. s.l.</biocase:value> | |||
... | |||
</biocase:scan> | |||
</biocase:content> | |||
</syntaxhighlight> | |||
<strong>Search:</strong> For this type of request, the content consists of the ABCD dataset(s). See the the [[SampleABCDDocument| ABCD2 example]]. | |||
=== Diagnostics (Debug Output) === | |||
This section is the most interesting part for debugging. If debug level is set to ''Info'' (which is recommended for debugging), it will document the processing of the request by the web service. The output is easy to understand, for example it will contain the SQL statements sent to the database. | |||
For a successful search request it could look similar to this: | For a successful search request it could look similar to this: | ||
<syntaxhighlight> | |||
<biocase:diagnostics> | |||
<biocase:diagnostic severity="INFO"> | |||
Datasource wrapper FloraExsiccataBavarica requested | |||
</biocase:diagnostic> | |||
<biocase:diagnostic severity="INFO"> | |||
Reading PSF from C:\Workspace\bps2\config\datasources\FloraExsiccataBavarica | |||
\provider_setup_file.xml | |||
</biocase:diagnostic> | |||
<biocase:diagnostic severity="DEBUG"> | |||
PSF: PSF=C:\Workspace\bps2\config\datasources\FloraExsiccataBavarica\provider_setup_file.xml, | |||
recLimit=100, loglevel=20, user=webuser, database=rbg, dbIP=192.168.2.10, dbms=mysql, | |||
encoding=latin_1, schemas={u'http://www.tdwg.org/schemas/abcd/2.06': | |||
<biocase.wrapper.psf_handler.SupportedSchema instance at 0x011F5B98>}, tablegraph=GRAPH: graph: | |||
unit-metadata, +++ ALIAS2TABLE: {u'unit': u'feb3', u'metadata': u'metadata'} | |||
</biocase:diagnostic> | |||
<biocase:diagnostic severity="INFO"> | |||
BioCASe protocol used. | |||
</biocase:diagnostic> | |||
<biocase:diagnostic severity="INFO"> | |||
HTTP parameter 'query' used for building the request. | |||
</biocase:diagnostic> | |||
<biocase:diagnostic severity="INFO"> | |||
Try to get CMF for namespace http://www.tdwg.org/schemas/abcd/2.06 | |||
</biocase:diagnostic> | |||
<biocase:diagnostic severity="INFO"> | |||
Load CMFile 'C:\Workspace\bps2\config\datasources\FloraExsiccataBavarica\cmf_ABCD_2.06.xml' | |||
</biocase:diagnostic> | |||
<biocase:diagnostic severity="INFO"> | |||
Executing SQL: 'SELECT DISTINCT unit.id FROM feb3 AS unit | |||
WHERE (unit.nameautor LIKE 'Allium %' ) LIMIT 11' | |||
</biocase:diagnostic> | |||
<biocase:diagnostic severity="INFO"> | |||
Hits: 8 | |||
</biocase:diagnostic> | |||
<biocase:diagnostic severity="INFO"> | |||
Executing SQL: 'SELECT unit.id, metadata.supplier_organisation, ... | |||
FROM feb3 AS unit LEFT JOIN metadata AS metadata ON (metadata.id = unit.metadata_fk) | |||
WHERE (unit.id IN (40, 41, 42, 43, 44, 45, 46, 47)) ORDER BY unit.id' | |||
</biocase:diagnostic> | |||
<biocase:diagnostic severity="INFO"> | |||
Hits: 8 | |||
</biocase:diagnostic> | |||
<biocase:diagnostic severity="INFO"> | |||
time to execute request is 0.46599984169 | |||
</biocase:diagnostic> | |||
</biocase:diagnostics> | |||
</syntaxhighlight> | |||
== Sample Errors and Warnings in the Debug Output == | == Sample Errors and Warnings in the Debug Output == | ||
<syntaxhighlight> | |||
<biocase:diagnostic severity="ERROR"> | <biocase:diagnostic severity="ERROR"> | ||
No DB connection could be established. Please verify DB state and connection parameters in your provider_setup_file.xml. | No DB connection could be established. Please verify DB state and connection parameters | ||
in your provider_setup_file.xml. | |||
</biocase:diagnostic> | </biocase:diagnostic> | ||
</syntaxhighlight> | |||
Well... just what it says. The Provider Software could not connect to the database to be published. Check the database connection settings (server IP, database name, user, and password) and make sure you’ve installed the Python package for the DBMS you’re using (see the <small>Libs test</small> page in <small>Utilities</small>). | |||
<syntaxhighlight> | |||
<biocase:diagnostic severity="INFO"> | |||
Try to get CMF for namespace http://www.tdwg.org/schemas/abcd/2.06 | |||
</biocase:diagnostic> | |||
<biocase:diagnostic severity="INFO"> | |||
Load CMFile 'C:\Workspace\bps2\config\datasources\flora\cmf_ABCD_2.06.xml' | |||
</biocase:diagnostic> | |||
<biocase:diagnostic severity="ERROR"> | |||
The CMF DB mapping file http://www.tdwg.org/schemas/abcd/2.06 was corrupt or could | |||
not be interpreted. | |||
</biocase:diagnostic> | |||
</syntaxhighlight> | |||
<biocase:diagnostic severity="ERROR">The requested concept /DataSets/DataSet/Units/Unit/Identifications/Identification/Result/TaxonIdentified/ScientificName/FullScientificNameString is not searchable for this provider! Please do a capabilities request to see all searchable concepts</biocase:diagnostic> | The requested schema (identified by the namespace http://www.tdwg.org/schemas/abcd/2.06) is not supported by that service. Create a mapping for this schema and map elements. | ||
<syntaxhighlight> | |||
<biocase:diagnostic severity="ERROR"> | |||
The requested concept /DataSets/DataSet/Units/Unit/Identifications/Identification/Result | |||
/TaxonIdentified/ScientificName/FullScientificNameString is not searchable for this provider! | |||
Please do a capabilities request to see all searchable concepts | |||
</biocase:diagnostic> | |||
</syntaxhighlight> | |||
Obvious - happens if you try to use a concept that is not mapped in a scan request or a filter. | Obvious - happens if you try to use a concept that is not mapped in a scan request or a filter. | ||
<biocase:diagnostic severity="ERROR">A SQL statement produced an error: SELECT unit.id, metadata.supplier_organisation, metadata.supplier_email, | |||
<syntaxhighlight> | |||
<biocase:diagnostic severity="ERROR"> | |||
A SQL statement produced an error: SELECT unit.id, metadata.supplier_organisation, | |||
metadata.supplier_email, ... | |||
FROM feb3 AS unit LEFT JOIN metadata AS metadata ON (metadata.id = unit.metadata_fk) | |||
WHERE (unit.id IN (2, 3, 4, 5, 6, 7, 8, 9, 10, 11)) ORDER BY unit.id | |||
</biocase:diagnostic> | |||
</syntaxhighlight> | |||
That could have a number of reasons: One of the table/column names that were set up in the configuration does not exist (because it was renamed or removed) or the credentials used by the BPS do not have sufficient privileges. Simply copy the SQL statement and execute it manually on the database with a regular database client that will show you the detailed error message returned by the DBMS. | That could have a number of reasons: One of the table/column names that were set up in the configuration does not exist (because it was renamed or removed) or the credentials used by the BPS do not have sufficient privileges. Simply copy the SQL statement and execute it manually on the database with a regular database client that will show you the detailed error message returned by the DBMS. | ||
One problem caused the next one in this sequence of warnings: The mandatory ABCD element was either not mapped or empty; therefore the respective record ( | <syntaxhighlight> | ||
<biocase:diagnostic severity="WARNING"> | |||
The mandatory child element SourceInstitutionID could not be created [0 existing, but 1 | |||
required]. The element /DataSets/DataSet/Units/Unit was also dropped. | |||
</biocase:diagnostic> | |||
<biocase:diagnostic severity="WARNING"> | |||
The mandatory child element Units could not be created [0 existing, but 1 required]. The | |||
element /DataSets/DataSet was also dropped. | |||
</biocase:diagnostic> | |||
</syntaxhighlight> | |||
One problem caused the next one in this sequence of warnings: The mandatory ABCD element ''SourceInstitutionID '' was either not mapped or empty; therefore the respective record (''unit'') was dropped. Because this happened for all units in the dataset, all units were dropped, resulting in an empty ''Units'' sub tree. The second warning tells you what happened then: Because the ''Units'' element is mandatory for the ''Dataset'' element, the whole dataset was dropped. As a result, the response ABCD document was empty. | |||
== Debugging a BioCASe Installation == | == Debugging a BioCASe Installation == | ||
In case the debug output of the web service doesn’t help you to find the problem, or if the BPS behaves not as intended without displaying any error messages, you should have a look at the debug logs written by the BPS. To turn on the Debug logs, go to the System Administration page and set Debug logs to True | In case the debug output of the web service doesn’t help you to find the problem, or if the BPS behaves not as intended without displaying any error messages, you should have a look at the debug logs written by the BPS. To turn on the Debug logs, go to the System Administration page and set <small>Debug logs</small> to <small>True</small>. | ||
[[File:instConfigTool.png|500px]] | |||
Redo the step that didn’t work and open the log folder of your BioCASe installation. There are several global log files (pywrapper_request.log, pywrapper_error.log, webapp_debug.log, webapp_error.log) and a debug files per data source (e.g. debug_flora.log). Open these files and see if they can give you a clue to the problem. | Redo the step that didn’t work and open the ''log'' folder of your BioCASe installation. There are several global log files (pywrapper_request.log, pywrapper_error.log, webapp_debug.log, webapp_error.log) and a debug files per data source (e.g. debug_flora.log). Open these files and see if they can give you a clue to the problem. | ||
If you still can’t get it running, contact the | If you still can’t get it running, [[Special:Contact|contact the BioCASe team]]. | ||
Latest revision as of 15:44, 18 August 2011
This tutorial explains how to debug a BioCASe web service and a BioCASe installation in general. If you follow the instructions and don’t manage to get your service running, please contact the BioCASe team.
Debugging a BioCASe Web Service
Debugging a BioCASe web service can be done with the manual Query Form. It allows you to load a BioCASe request (Search/Scan) from a template, edit the parameters of the request (e.g. the filter) and will show you the response document, which holds the requested ABCD records and useful debug information.
Opening the Query Form
There are several ways to open the Query Form.
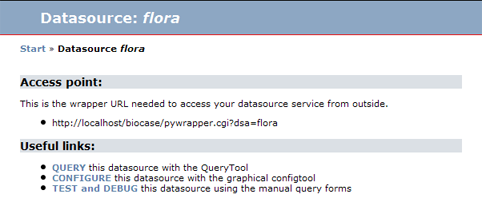
On the entry page of a datasource, TEST and DEBUG will open the Query Form:
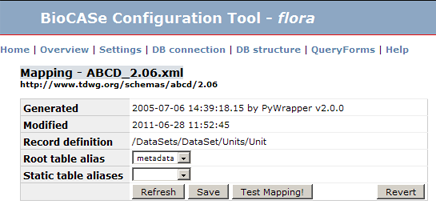
In the data source configuration tool, the link to the according query form can be always found in the link list at the top of the page. Moreover, in the mapping editor, the button Test mapping! will open the Query Form in a separate tab:
Basic Usage
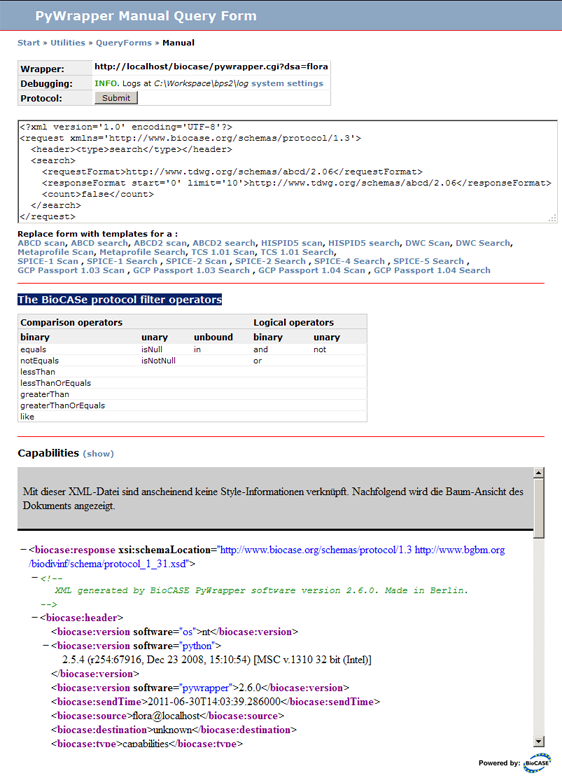
On top of the Query Form you can see the URL of your web service. In this case it is http://localhost/biocase/pywrapper.cgi?dsa=flora, flora being the name of the datasource. Make sure this is the correct access point of the web service you want to debug!
The usage of the Query Form is very straightforward:
- Click on one of the links below the text box to load a template, for example for an ABCD2 Scan or ABCD2 Search;
- Edit the request parameters;
- Click on Submit to get the response document.
The section BioCASe protocol filter operators lists the operators that can be used for creating complex filters that combine several filter criteria. More about creating filters can be found in the BioCASe Protocol documentation at http://www.biocase.org/products/protocols/index.shtml.
Clicking on the Show link in the Capabilities section will show the Capabilities response in a frame of the Query Form. This is useful, since it shows the namespaces for the schemas supported by the web service (which is required in the request text) and XPaths of mapped ABCD elements (required for creating filters on these elements). By using Copy & Paste you can spare the trouble of entering these monstrous strings of characters.
Changing the Debug Level for a Data Source
Debug info can be set to one of four levels for a BioCASe data source:
- Error is the highest level will only output errors that prevent the web server from answering a request.
- Warning will output errors that keep BioCASe from answering a request and warnings that don’t prevent the fulfilling of the request, but should be analysed carefully. For example, they might tell you that records have been dropped because mandatory ABCD elements have not been mapped or were empty for certain records.
- Info is the default and will add some more information about how the Provider Software processes the request.
- Debug is the most detailed level and will produce very verbose debug output. It adds very comprehensive information about how the ABCD documents are constructed and is suitable only for experienced users.
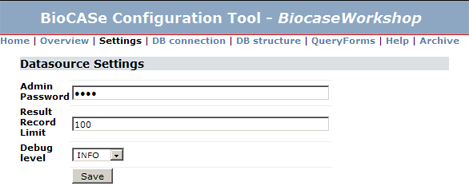
For most cases, keeping the default Info level should be sufficient for testing and debugging a web service. For production use, you should set it to Error later. You can do this in the configuration of a datasource under Settings:
Analyzing the Response Document
Upon clicking Submit, the Query Form will send the request to the web service and wait for the response. It might take some time – up to minutes – until the response document shows up. Amongst others, this depends on
- the complexity of the query (especially the filters),
- the size of the dataset returned,
- the debug level set (“debug” results in very exhaustive debug output),
- the performance of the servers running BioCASe and the database,
- the network bandwidth.
The response document consists of three sections (a full response document can be found here):
Header
This section contains information about the BioCASe installation – operating system, DBMS used, Python/BioCASe version etc. It is intended for a consumer application and won’t be very helpful for debugging:
<biocase:header>
    <biocase:version software="os">nt</biocase:version>
    <biocase:version software="python">2.5.4 (r254:67916, Dec 23 2008, 15:10:54)
         [MSC v.1310 32 bit (Intel)]</biocase:version>
    <biocase:version software="pywrapper">2.6.0</biocase:version>
    <biocase:version software="dbmod">MS SQL Server module v1.01 using ceODBC ?</biocase:version>
    <biocase:sendTime>2011-06-29T16:00:47.253000</biocase:sendTime>
    <biocase:source>AlgenEngels@localhost</biocase:source>
    <biocase:destination>127.0.0.1</biocase:destination>
    <biocase:type>search</biocase:type>
</biocase:header>
Content
This section makes up the payload of the response document, depending on the type of request:
Capabilities: Lists all schemas supported by the web service. For each schema, all mapped concepts (identified by their XPaths) are listed with data type and searchable flag.
<biocase:content recordCount="0" recordDropped="0" recordStart="0" totalSearchHits="0">
    <biocase:capabilities>
        <biocase:SupportedSchemas namespace="http://www.tdwg.org/schemas/abcd/2.06" request="true" response="true">
            <biocase:Concept datatype="normalizedString" searchable="1">/DataSets/DataSet/ContentContacts/ContentContact/Address</biocase:Concept>
            <biocase:Concept datatype="normalizedString" searchable="1">/DataSets/DataSet/ContentContacts/ContentContact/Email</biocase:Concept>
            <biocase:Concept datatype="normalizedString" searchable="1">/DataSets/DataSet/ContentContacts/ContentContact/Name</biocase:Concept>
            <biocase:Concept datatype="normalizedString" searchable="1">/DataSets/DataSet/Metadata/Description/Representation/Details</biocase:Concept>
            ...
        </biocase:SupportedSchemas>
    </biocase:capabilities>
</biocase:content>
Scan: The document will simply list all distinct values for the concept specified in the request. When done for the scientific name, it would look similar to this:
<biocase:content recordCount="1664" recordDropped="0" recordStart="0" totalSearchHits="1664">
    <biocase:scan>
        <biocase:value>Achillea atrata L.</biocase:value>
        <biocase:value>Achillea millefolium L.</biocase:value>
        <biocase:value>Achillea nobilis L. ssp. nobilis</biocase:value>
        <biocase:value>Achillea ptarmica L.</biocase:value>
        <biocase:value>Acinos alpinus (L.) Moench</biocase:value>
        <biocase:value>Acinos arvensis (Lam.) Dandy</biocase:value>
        <biocase:value>Aconitum degenii ssp. paniculatum (Arcang.) Mucher</biocase:value>
        <biocase:value>Aconitum lycoctonum L. ssp. lycoctonum</biocase:value>
        <biocase:value>Aconitum napellus L. s.l.</biocase:value>
        ...
    </biocase:scan>
</biocase:content>
Search: For this type of request, the content consists of the ABCD dataset(s). See the the ABCD2 example.
Diagnostics (Debug Output)
This section is the most interesting part for debugging. If debug level is set to Info (which is recommended for debugging), it will document the processing of the request by the web service. The output is easy to understand, for example it will contain the SQL statements sent to the database.
For a successful search request it could look similar to this:
<biocase:diagnostics>
  <biocase:diagnostic severity="INFO">
    Datasource wrapper FloraExsiccataBavarica requested
  </biocase:diagnostic>
  <biocase:diagnostic severity="INFO">
    Reading PSF from C:\Workspace\bps2\config\datasources\FloraExsiccataBavarica
      \provider_setup_file.xml
  </biocase:diagnostic>
  <biocase:diagnostic severity="DEBUG">
    PSF: PSF=C:\Workspace\bps2\config\datasources\FloraExsiccataBavarica\provider_setup_file.xml,
    recLimit=100, loglevel=20, user=webuser, database=rbg, dbIP=192.168.2.10, dbms=mysql,
    encoding=latin_1, schemas={u'http://www.tdwg.org/schemas/abcd/2.06':
    <biocase.wrapper.psf_handler.SupportedSchema instance at 0x011F5B98>}, tablegraph=GRAPH: graph:
    unit-metadata,   +++  ALIAS2TABLE: {u'unit': u'feb3', u'metadata': u'metadata'}
  </biocase:diagnostic>
  <biocase:diagnostic severity="INFO">
    BioCASe protocol used.
  </biocase:diagnostic>
  <biocase:diagnostic severity="INFO">
    HTTP parameter 'query' used for building the request.
  </biocase:diagnostic>
  <biocase:diagnostic severity="INFO">
    Try to get CMF for namespace http://www.tdwg.org/schemas/abcd/2.06
  </biocase:diagnostic>
  <biocase:diagnostic severity="INFO">
    Load CMFile 'C:\Workspace\bps2\config\datasources\FloraExsiccataBavarica\cmf_ABCD_2.06.xml'
  </biocase:diagnostic>
  <biocase:diagnostic severity="INFO">
    Executing SQL: 'SELECT DISTINCT unit.id FROM feb3 AS unit
    WHERE (unit.nameautor LIKE 'Allium %' ) LIMIT 11'
  </biocase:diagnostic>
  <biocase:diagnostic severity="INFO">
    Hits: 8
  </biocase:diagnostic>
  <biocase:diagnostic severity="INFO">
    Executing SQL: 'SELECT unit.id, metadata.supplier_organisation, ...
    FROM feb3 AS unit LEFT JOIN metadata AS metadata ON (metadata.id = unit.metadata_fk)
    WHERE (unit.id IN (40, 41, 42, 43, 44, 45, 46, 47)) ORDER BY unit.id'
  </biocase:diagnostic>
  <biocase:diagnostic severity="INFO">
    Hits: 8
  </biocase:diagnostic>
  <biocase:diagnostic severity="INFO">
    time to execute request is 0.46599984169
  </biocase:diagnostic>
</biocase:diagnostics>
Sample Errors and Warnings in the Debug Output
<biocase:diagnostic severity="ERROR">
    No DB connection could be established. Please verify DB state and connection parameters
    in your provider_setup_file.xml.
</biocase:diagnostic>
Well... just what it says. The Provider Software could not connect to the database to be published. Check the database connection settings (server IP, database name, user, and password) and make sure you’ve installed the Python package for the DBMS you’re using (see the Libs test page in Utilities).
<biocase:diagnostic severity="INFO">
    Try to get CMF for namespace http://www.tdwg.org/schemas/abcd/2.06
</biocase:diagnostic>
<biocase:diagnostic severity="INFO">
    Load CMFile 'C:\Workspace\bps2\config\datasources\flora\cmf_ABCD_2.06.xml'
</biocase:diagnostic>
<biocase:diagnostic severity="ERROR">
    The CMF DB mapping file http://www.tdwg.org/schemas/abcd/2.06 was corrupt or could
    not be interpreted.
</biocase:diagnostic>
The requested schema (identified by the namespace http://www.tdwg.org/schemas/abcd/2.06) is not supported by that service. Create a mapping for this schema and map elements.
<biocase:diagnostic severity="ERROR">
    The requested concept /DataSets/DataSet/Units/Unit/Identifications/Identification/Result
    /TaxonIdentified/ScientificName/FullScientificNameString is not searchable for this provider!
    Please do a capabilities request to see all searchable concepts
</biocase:diagnostic>
Obvious - happens if you try to use a concept that is not mapped in a scan request or a filter.
<biocase:diagnostic severity="ERROR">
    A SQL statement produced an error: SELECT unit.id, metadata.supplier_organisation,
    metadata.supplier_email, ...
    FROM feb3 AS unit LEFT JOIN metadata AS metadata ON (metadata.id = unit.metadata_fk)
    WHERE (unit.id IN (2, 3, 4, 5, 6, 7, 8, 9, 10, 11)) ORDER BY unit.id
</biocase:diagnostic>
That could have a number of reasons: One of the table/column names that were set up in the configuration does not exist (because it was renamed or removed) or the credentials used by the BPS do not have sufficient privileges. Simply copy the SQL statement and execute it manually on the database with a regular database client that will show you the detailed error message returned by the DBMS.
<biocase:diagnostic severity="WARNING">
    The mandatory child element SourceInstitutionID could not be created [0 existing, but 1
    required]. The element /DataSets/DataSet/Units/Unit was also dropped.
</biocase:diagnostic>
<biocase:diagnostic severity="WARNING">
    The mandatory child element Units could not be created [0 existing, but 1 required]. The
    element /DataSets/DataSet was also dropped.
</biocase:diagnostic>
One problem caused the next one in this sequence of warnings: The mandatory ABCD element SourceInstitutionID was either not mapped or empty; therefore the respective record (unit) was dropped. Because this happened for all units in the dataset, all units were dropped, resulting in an empty Units sub tree. The second warning tells you what happened then: Because the Units element is mandatory for the Dataset element, the whole dataset was dropped. As a result, the response ABCD document was empty.
Debugging a BioCASe Installation
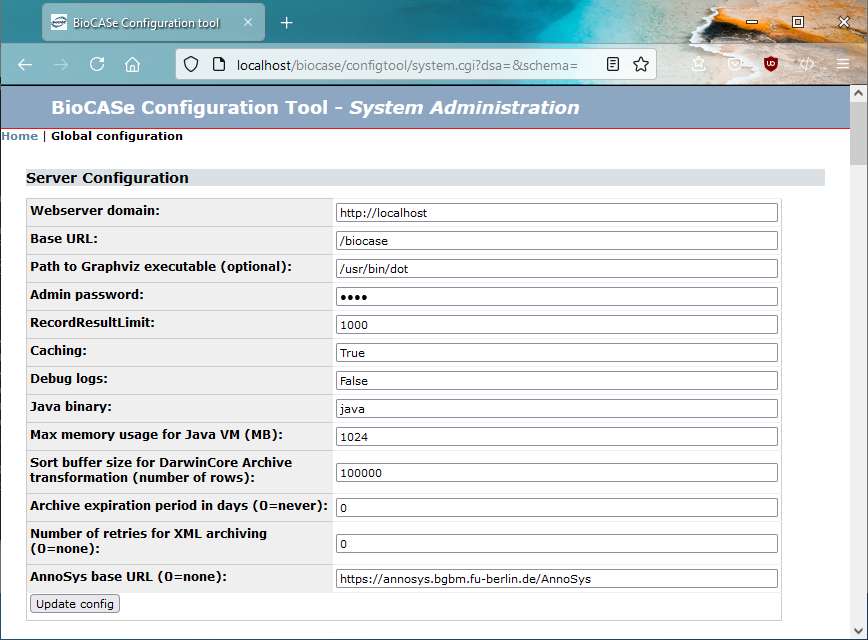
In case the debug output of the web service doesn’t help you to find the problem, or if the BPS behaves not as intended without displaying any error messages, you should have a look at the debug logs written by the BPS. To turn on the Debug logs, go to the System Administration page and set Debug logs to True.
Redo the step that didn’t work and open the log folder of your BioCASe installation. There are several global log files (pywrapper_request.log, pywrapper_error.log, webapp_debug.log, webapp_error.log) and a debug files per data source (e.g. debug_flora.log). Open these files and see if they can give you a clue to the problem.
If you still can’t get it running, contact the BioCASe team.
